Scientific Assessment of Ozone Depletion: 2010
Prologue Figure P-1
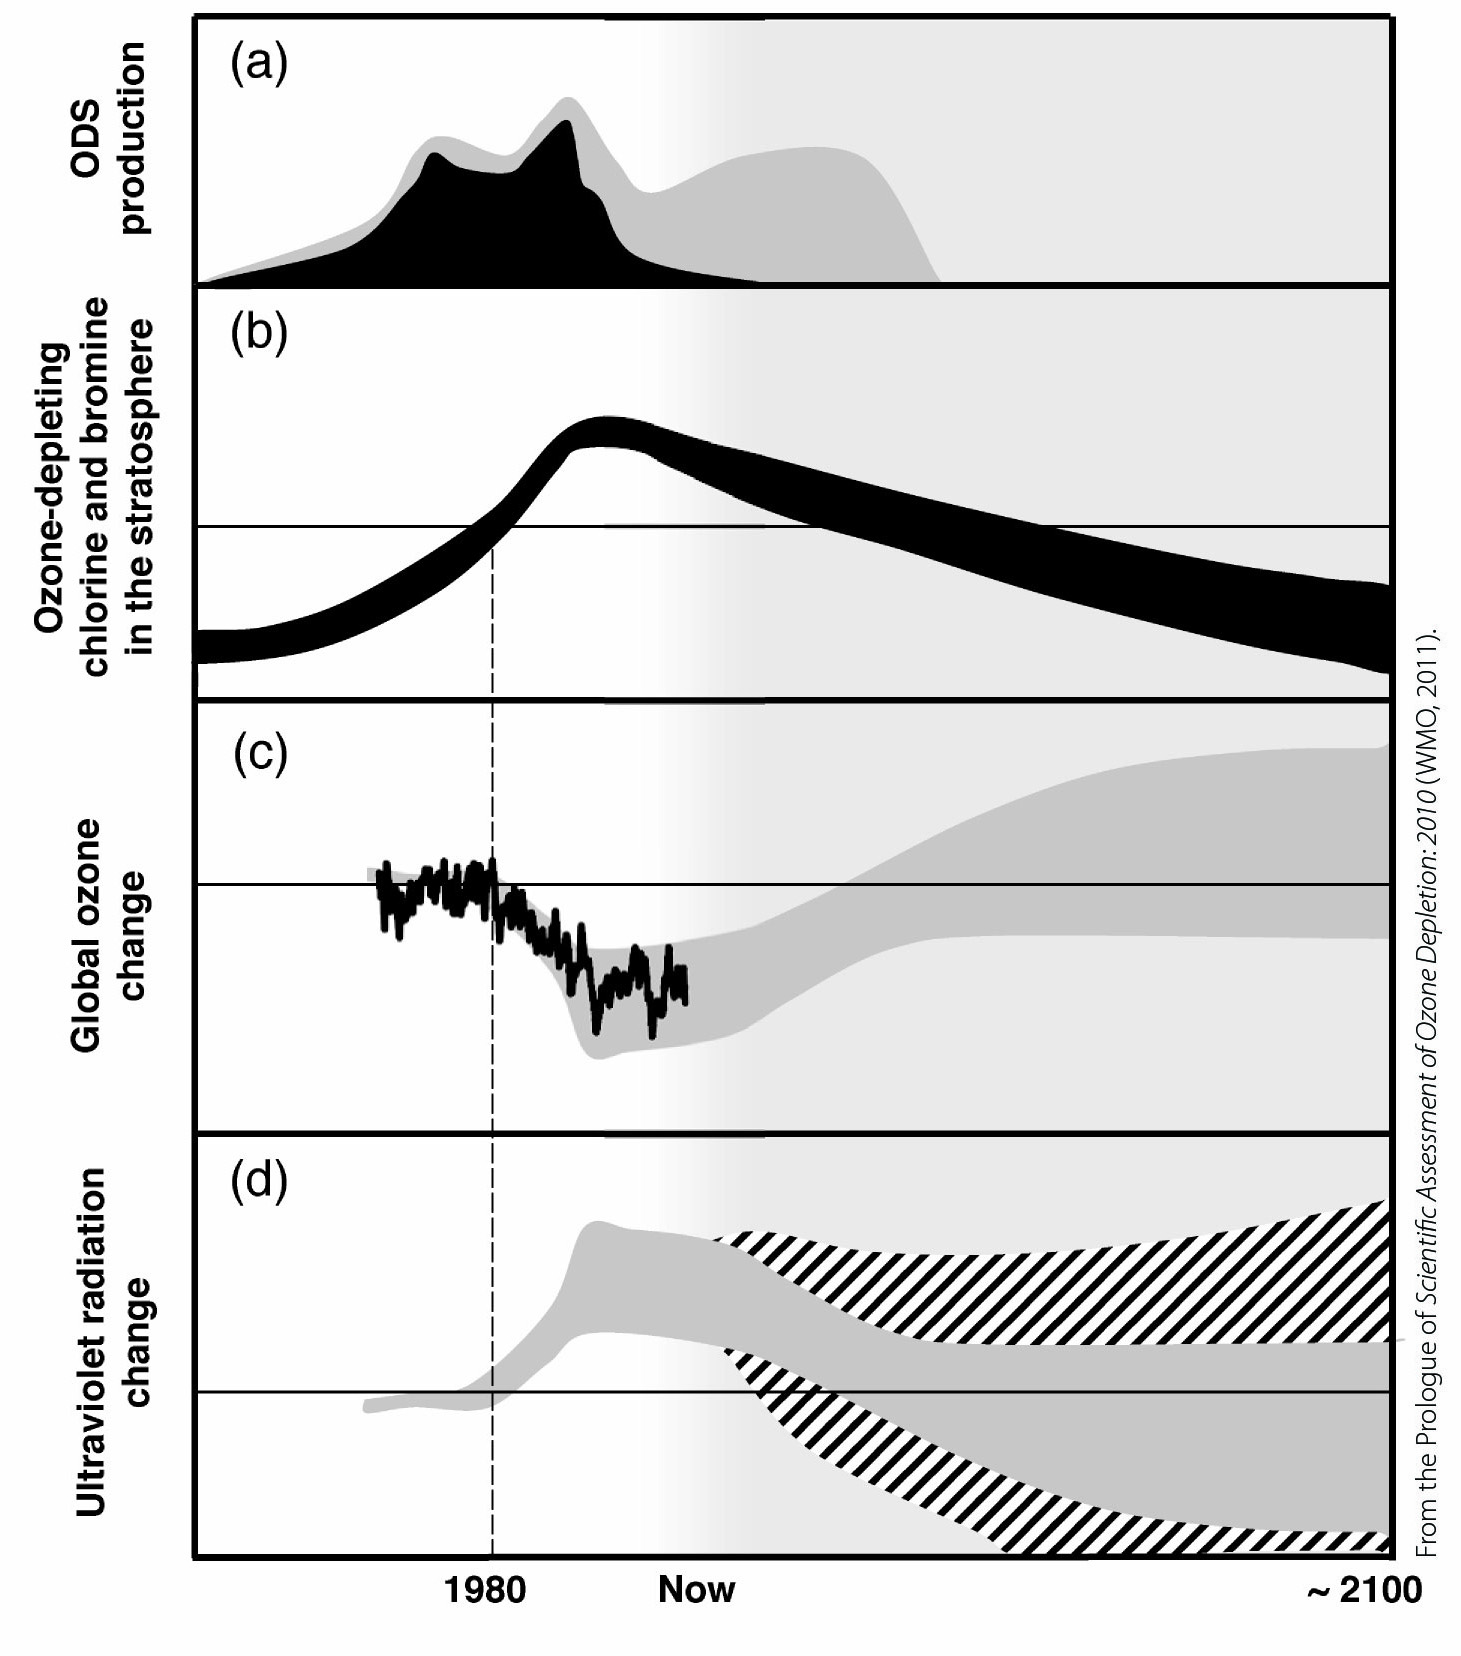
Figure P-1. Ozone-Depleting Substances, the Ozone Layer, and UV Radiation: Past, Present, and Future
(a) Production of ozone-depleting substances (ODSs) before and after the 1987 Montreal Protocol and its Amendments, from baseline scenario A1. Chlorofluorocarbons (CFCs) are shown in black; additional ODSs from hydrochlorofluorocarbons (HCFCs) are in gray. Note: HCFCs, which have been used as CFC replacements under the Protocol, lead to less ozone destruction than CFCs.
(b) Combined effective abundances of ozone-depleting chlorine and bromine in the stratosphere. The range reflects uncertainties due to the lag time between emission at the surface and the stratosphere, as well as different hypothetical ODS emission scenarios.
(c) Total global ozone change (outside of the polar regions; 60°S-60°N). Seasonal, quasi-biennial oscillation (QBO), volcanic, and solar effects have been removed. The black line shows measurements. The gray region broadly represents the evolution of ozone predicted by models that encompass the range of future potential climate conditions. Pre-1980 values, to the left of the vertical dashed line, are often used as a benchmark for ozone and UV recovery.
(d) Estimated change in UV erythemal ("sunburning") irradiance for high sun. The gray area shows the calculated response to the ozone changes shown in (c). The hatched area shows rough estimates of what might occur due to climate-related changes in clouds and atmospheric fine particles (aerosols).